

The bottom line: KBB Private Party values are a useful starting point, but they can run higher than what a buyer actually offers. Trade-in estimates tend to be closer to real dealer offers, but still vary with your car’s condition and your local market.
The private party gap usually comes from the condition grade. KBB’s picker stops at Fair, while a real buyer’s form docks a car with body damage about 13% against the same car without it, across cars of every age in our offer data.
For a realistic price, pair KBB with Edmunds, J.D. Power and a handful of real local listings on Facebook Marketplace, Autotrader or Craigslist, then average the results.
Before listing privately, get a real offer from an online buyer to set a guaranteed floor price. Compare offers from multiple services with Sell Car Advisor to see what buyers will offer for it right now.
Key Takeaways
- KBB’s private party value is a starting point that usually sits above what a buyer offers, and the gap is widest when the condition grade is too generous.
- Condition: KBB says only 2% of the cars it values qualify as Excellent, and a real buyer’s form takes a separate cut for body damage, on cars of every age in our data; picking the wrong grade is the most common reason the estimate misses.
- Options: KBB may not fully capture aftermarket modifications or rare factory packages, so unique features could add value the estimate doesn’t reflect.
- Region: local demand can push prices higher or lower than KBB’s range, even after entering your ZIP code.
- Instant Cash Offer: KBB’s Instant Cash Offer is a real offer from a participating dealer; its Trade-In Value is an estimate range, not a guaranteed number.
- Carvana or CarMax can give you a quote before you list privately, which shows how far KBB’s number sits from what a buyer will pay for your car.

Automated assistant: general info, not legal advice
Answers come from our state paperwork data and published guides. Confirm anything binding with your state DMV.
Compare Instant Offers




What Are Kelley Blue Book Values?
KBB has been around since 1926, when it printed a blue book for dealers. Today it’s all online, and it gives different values depending on how you plan to sell your car.
KBB gives three values:
Private Party Value
What you might get selling to another person (this is your main number). The range is wider than the trade-in range because person-to-person prices vary more than dealer sales do; no guide has a record of private sales to build from, which the J.D. Power guide explains.

Trade-In Value
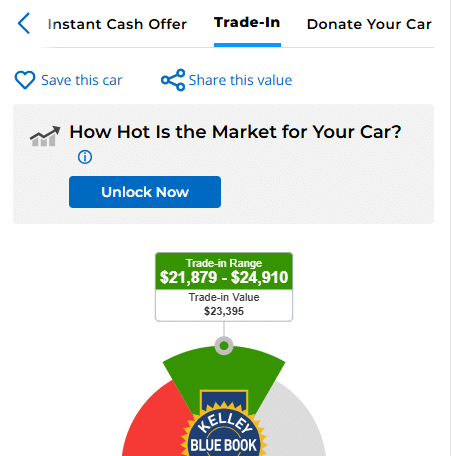
KBB’s estimated range of what dealers might offer (just a reference estimate). It sits below the private party value because a dealer buys to resell; the dealer-versus-private guide has where the margin goes.
Instant Cash Offer
A real, specific dollar offer from participating dealers (a separate service; what an instant cash offer is). The dealer inspects the car before paying, and an offer built on an over-generous condition answer gets revised.

How Does KBB Calculate Car Values?
KBB calls its pricing system the “Price Advisor,” which shows the Fair Purchase Price, Fair Market Range, and other pricing details based on what it calls “a real look at what a car should cost in your area.”
What goes into your car’s value:
- Year, make, model, and mileage
- Condition (Fair, Good, Very Good, or Excellent)
- Options and features
- Where you live
- Time of year
Most sellers go wrong on the condition rating. KBB says only 2% of the cars it values qualify as “Excellent.” If your car has any scratches, worn seats, or mechanical issues, your car is probably “Good” or “Fair.”
KBB’s picker has four grades and stops at Fair. A real buyer’s form asks about damage item by item: across cars of every age, buyers offer about 13% less for a car with body damage than for the same car without it, once age and mileage are matched.
What the condition of a car does to its best offer 1,564 cars of every age quoted by up to three buyers, compared inside matched mileage and age groupsShow the numbers
Condition Change in best offer Offers Catalytic converter missing -57% 389 Does not start -46% 916 Starts but does not drive -29% 686 Sitting at a mechanic -23% 485 Dashboard warning light on -18% 1,434 Broken glass, mirror or light -14% 867 Body damage -13% 867 Loan outstanding -5% 645 Interior damage -3% 867 Accident history 1% 1,434 
Why Does KBB Often Overestimate Private Party Prices?
KBB is a good starting point, but a few limits mean its numbers often run higher than what buyers offer. The causes:
| Reason | What It Means for You |
|---|---|
| Time Lag | Car values change fast, but KBB needs time to collect and analyze new data. KBB’s own average listing price peaked at $31,095 in April 2022 and stood at $27,028 in July 2026; a guide built on periodic data can’t track a swing like that in real time. |
| Limited Options Coverage | If your car has expensive add-ons or modifications, KBB might not account for them properly. |
| Condition Confusion | One condition grade up or down moves the estimate a long way, but KBB’s descriptions aren’t always clear about which category your car actually fits. |
| Regional Differences | Buyers in a rural, truck-heavy market might offer far more for a pickup than buyers in a city, but KBB doesn’t always capture those regional preferences. |
When Does Local Market Research Beat KBB?
Before setting your final price, spend time checking what similar cars are actually listed for in your area (the best places to list). Facebook Marketplace, Autotrader, and Craigslist show this week’s asking prices near you, which is more local than the regional figure KBB works out from your ZIP code.
Why Local Listings Matter More:
- You see what people are actually asking right now
- Regional preferences affect demand (trucks in rural areas, hybrids in cities)
- Local economic conditions impact buying power
- Seasonal patterns vary by location
How to Research Smart:
- Look at 5 to 8 similar cars (within two model years either way, similar mileage)
- Note which listings stay up for weeks (probably overpriced)
- Check for “price reduced” indicators
- See what’s actually selling, not just what’s listed
If KBB and local listings differ a lot, trust your local market, because that’s where the car sells.
Use Online Car Buyers as Your Pricing Floor
Before finalizing your asking price, get quotes from online car buyers like Carvana and CarMax. They’re real offers you can accept, not estimates.
Why This Helps Your Pricing:
- Gives you a guaranteed backup option if a private sale doesn’t work out
- Provides a reality check on your car’s actual condition
- Creates a negotiation floor
- Shows potential buyers you’ve done your homework
Smart Strategy: Price your private sale a little above the highest online offer, enough to leave room to negotiate while still doing better than the easy route.
Getting Quotes: Most online services take a few minutes and don’t require commitment. Get two or three quotes, not one.
On cars 10 years and older, the best and worst same-day offer on the same car are $314 apart at the median in our data. In 39% of cars the best offer is at least double the worst, and a quarter of cars saw a gap of at least $823.
How far apart the best and worst offer are on the same car 998 cars 10 years and older, each quoted by two or more buyers on the same dayShow the numbers
Best offer against worst Share of cars Offers Within 10% 9.5% 95 10% to 25% apart 11.7% 117 25% to 50% apart 17.5% 175 50% to 100% apart 21.8% 218 Double to triple 18.8% 188 More than triple 20.5% 205
How to Use KBB Effectively When Selling Privately
KBB’s result depends on how you use it:
| Strategy | What to Do |
|---|---|
| Be Honest About Condition | Walk around your car and really look at it. Check for scratches, dents, worn tires, and interior damage. When in doubt, go with the lower condition rating. |
| Research Your Local Market | Look at similar cars for sale in your area. If everyone’s asking well above what KBB suggests, that tells you something about local demand. |
| Factor in Timing | Across the market, sales peak in May and trough in January by the Federal Reserve’s seasonal factors, and December runs 19% above an average month for pickups. On cars 10 years and older, offers run highest in April and lowest in September, a swing of $145. |
| Know Your Car’s History | Get a vehicle history report before you set your price. Buyers will pull one anyway, so knowing what it shows lets you price accurately and avoid surprises. |
| Handle Lowball Offers | When buyers cite lower values from other sites, ask which specific condition rating and options they selected. Their figure often uses a different grade or different options. |
| Know When KBB Is Off | If similar cars in your area are selling for well above or below what KBB suggests, trust your local market over the website. |
| Have a Backup Plan | If you’re not getting offers close to your expectations after a few weeks, reassess your car’s condition rating or consider whether your local market differs from KBB’s assumptions. Lots of views but no offers means the price; no views at all means the listing and the photos. |
KBB vs Other Valuation Tools
Don’t rely on one source. What each pricing tool is good for:
| Tool | What it is good for |
|---|---|
| KBB | The starting point; the guide buyers recognize most |
| Edmunds | A second private party figure, with five condition grades to KBB’s four |
| J.D. Power | Built on retail dealer sales, so its trade-in value is the one to check against a dealer’s offer |
| Local listings | Current asking prices near you, not sale prices |
| Online buyers | Real offers you can accept, which set your floor |
Check two or three sources, then use local market research to see what’s actually selling in your area. Our J.D. Power guide covers how the three guides’ data differ.
Real-World Example for Private Sellers
Take an actual 2021 Jeep Grand Cherokee Limited 4×4 with 40,000 miles and run it through the multi-source pricing method. A five-year-old midsize SUV has lost about 47.0% of its original price on average, by iSeeCars, more than the market as a whole, so the guides have plenty of room to disagree.
How much a five-year-old car has lost, by type 950,000 five-year-old cars sold March 2025 to February 2026Show the numbers
Type Five-year depreciation Trucks 34.2% Hybrids 35.4% Small SUVs 41.7% All cars 41.8% Midsize SUVs 47.0% Large SUVs 52.1% Electric 57.2% 

Step 1: Check KBB
KBB shows this Jeep as a range. Since KBB tends to run high, use the low end of the range.
That gives a more realistic baseline.

Step 2: Get Edmunds Value
Edmunds put the car within a few hundred dollars of KBB’s low end, slightly above it, which is how far two guides can sit apart on the same car.

Step 3: Research Local Market
On Craigslist, the one Grand Cherokee with comparable mileage was listed below both guides. That matters because it shows what sellers near you are asking.

Step 4: Get Online Buyer Quote
Carvana’s real offer on the same car landed between the local listing and the guide values. Unlike the others, it’s an offer you can accept: your guaranteed floor if the private sale doesn’t work out.

What This Means: Value Calculation
You end up with four different numbers: KBB’s low end, the Edmunds value, the local asking price, and Carvana’s offer.
Average the first three and leave the online offer out, because it’s the floor, not an estimate. That average is your realistic starting point.
The online offer landing close to the average confirms the research is on track. This beats trusting just one source because each tool has its own quirks.
Final Pricing Strategy
With that average and that floor:
- List for: a little above the average, for negotiation room
- Target price: the average itself
- Walk-away minimum: the online offer, your backup
The average gives you a solid foundation that accounts for both online estimates and local market conditions. The online offer is your floor: you know you can get at least that much if private selling doesn’t work out.
Note: This example uses just one Craigslist listing for demonstration. For a complete picture, check 5 to 8 similar local listings and average out the middle ones (ignore obvious outliers).
Cars sitting unsold for weeks are probably overpriced and shouldn’t factor into your average.
Compare instant offers before you accept one
Compare instant offers before you accept one
Frequently Asked Questions
Does Kelley Blue Book take a cut when you sell a car privately?
No, not on a sale you arrange yourself. KBB also lists cars through Private Seller Exchange, a marketplace it shares with Autotrader. That service holds the buyer’s payment until the handoff and handles the title transfer.
KBB’s Instant Cash Offer comes from a participating dealer, not from KBB.
Why does a dealer offer less than the KBB private party value?
A dealer buys to resell, so the offer has to leave room for reconditioning, the lot and a margin. The average franchised dealer made $1,409 gross on each used car it retailed in the year to mid-2026, by Presidio’s dealership benchmark, before its own costs.
That is why KBB shows a separate, lower Trade-In Value, and why a dealer’s asking price sits above the private party figure. The dealer trade-in guide covers what the dealer does with your car.
Can KBB’s Instant Cash Offer be lowered when the dealer sees the car?
Yes. The offer is built on what you entered, and the participating dealer inspects the car before paying; an offer built on an over-generous condition answer gets revised.
Answer the condition quiz as a buyer would grade it, and the number you walk in with is the number you leave with.
What if my car is in worse than Fair condition on KBB?
KBB’s online tool grades from Excellent down to Fair and has no grade below it, so a car with real damage or one that doesn’t start gets a number that assumes Fair, or no number at all.
In our data, buyers offer far less for a car that doesn’t start than for the same car running, so skip the guide and get real offers; the junk car guide covers the buyers that take those cars.
Can a car sell for more than its KBB value?
Yes, when local demand runs ahead of KBB’s figure for your region, and on models that hold their value. iSeeCars puts the Toyota RAV4 at 25.2% of its price lost after five years, well under the market average, so buyers may offer more for a well-kept one than a guide built on the average car shows.
The gap runs both ways: a common model in a slow local market can sit below KBB’s range for weeks.

Article Update History
Market prices now come from Kelley Blue Book, depreciation from iSeeCars, and condition and offer figures from Sell Car Advisor quote data.
Checked against its sources; nothing needed to change.
Originally posted and shared with our readers.

Sources
Kelley Blue Book: condition grades
KBB's four condition grades and the share of the cars it values in each: Excellent 2%, Very Good 28%, Good 50%, Fair 20%. Accessed Oct. 20, 2026
What the condition of a car does to its best offer, Junk Car Value Statistics
"1,564 cars of every age quoted by up to three buyers, compared inside matched mileage and age groups" Accessed Oct. 16, 2026
How far apart the best and worst offer are on the same car, Junk Car Value Statistics
"998 cars 10 years and older, each quoted by two or more buyers on the same day" Accessed Oct. 16, 2026
Junk Car Value Statistics, Sell Car Advisor
"On this page: 5 figures from 17,628 instant cash offers, and 5 figures from same-day quotes by several buyers" Accessed Oct. 19, 2026
"$31,095, used car price peak; $27,028, average used car listing price" Accessed Sep. 11, 2026
"May, month with the most car sales; January, month with the fewest car sales; 19% above, december truck sales against an average month" Accessed Sep. 11, 2026
"47.0%, five-year depreciation, midsize SUVs; 25.2%, five-year depreciation, Toyota RAV4" Accessed Sep. 11, 2026
"$1,409, dealer gross on a used car" Accessed Sep. 11, 2026
Found this useful? Show Sell Car Advisor first when you search on Google.
Add us as a preferred source on Google